Chapter 1: User Interface
![]()
The first ever review was done by Catalin Chelariu of Softpedia.com, and in his first review, he stated: “i liked the general idea of the whole thing”. What followed was a long list of desirements and missing documentation, concluding in the good thing to say is that it works allright. So he rated us with 2.5 Stars, and we took that review to fix a lot of things he mentioned. It was the worst ever review we got by a Software magazine, lifetime.
After a few sleepless nights in August 2016, we decided to work our way all up to the top.
And so, this documenation was created as well, part by part.
- Simulation Model Selector.
- Main Menu.
- Time Ruler.
- Squared Icons.
- Dynamic Idea – User Voting.
- Dynamic Support – User Voting.
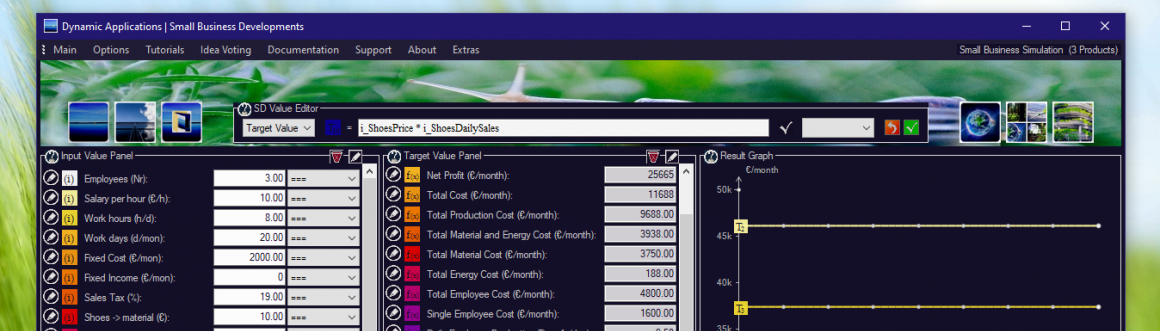
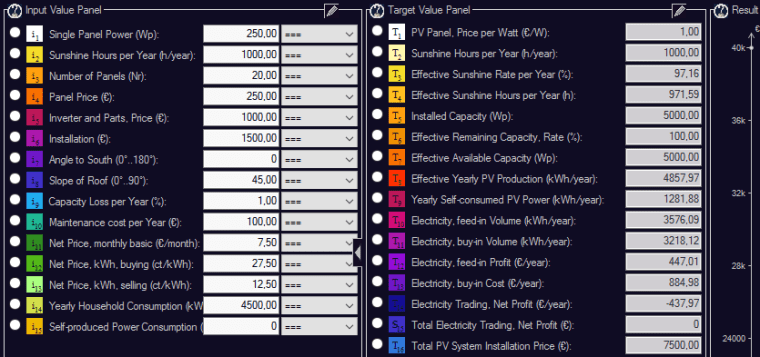
- Input Value Panel.
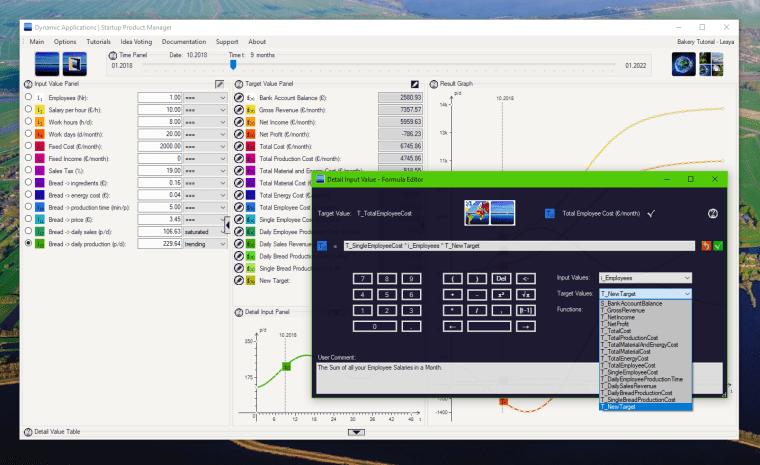
- Detail Input Panel.
- Target Values and Formula.
- A short excurse in Prediction Theory.
- Result Graph Display.
- Detail Value Table.
- PD User Interface Settings dialog.
- Simulation Model Configurator.
- Simulation Model, Date and Time Settings.
Simulation Model Selector

When starting up, Predicted Desire automatically opens the Simulation Model Selector.
Here, you can select your Simulation Model of interest, defining all your Input Values, Target Values, and Formula (as explained below). A progress bar will inform you about the progress of loading the model, and solving its formula system for the first time.
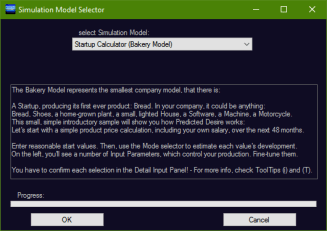
The user interface with all its Input and Target Values to select from will then automatically be built to reflect your model. At the moment, only the Startup Calculator simulation is available. However, the System Dynamics approach of Predicted Desire allows us to declare a complete simulation model within a single file.
Loading a new simulation model will also reset its configuration. All Input Values will be reset to their default, with stable development over time.
We are working on a Premium Version, based on micro-payment.
The free version of should always be free; the premium version should add features mainly interesting for the professional user. There, it should be possible to extend and modify any model’s Input Values and Target Formula, yourself. Build your own simulation model for your specific product. Also, we’re planning to support the XMILE model configuration standard for System Dynamics calculations. It will allow us to load and save models from an XML file. Also, it should be possible to run SD models developed on competing platforms.
Main Menu
![]()
File Menu
- Load Model…
will open the Simulation Model Selector. Here you can select your model of interest.
- Quit
will terminate Predicted Desire. Same as closing the main window.
Options Menu and Settings Dialog
![]()
- General Settings
we support (at the moment) to activate English and German simulation models by activating the language checkbox of same kind. As this is a worldwide approach, and this project is much about being efficient in managing a company, we’re a little hesitating to translate our product into all kinds of languages from day one.
We’ll work to support all kinds of languages as requested as long as This Tweet got the top most votes, and you guys got the patience to wait. So it’s nothing personal, against the nationalist people or so, we’ve just decided to go international from day one for business reasons.
Instead, we work on a possibility for changing any simulation value labels, formula, items and comments directly through the user interface, itself. So everyone could adjust the standard models to any language. It’s a do-it-yourself approach, yes, but this project is much about people who have to start from very low budget (as ourselves) or even from nothing but a used laptop (we started from a 2009 MacBook Pro in 2016), and still be successful in life, and who are willing to contribute a little.
Documentation Menu
![]()
- PD Online Documentation…
will open your default Web browser showing the main documentation page.
For ease of navigation, a collection of sub-menus will call the detail sections within this documentation.
About Menu
![]()
- Website / Home…
will open dynamic-applications.org in your default Web browser.
- about Dynamic Applications…
will open the Website showing an article about Dynamic Applications, describing the general company idea and our vision. It includes a free bonus offer for every reader.
- about System Dynamics…
will open the Website with an article about System Dynamics, its history, the Club of Rome, the famous World Model III predictions, and our general motivation.
- Update…
will open the Predicted Desire download page. At the moment, there is no push service included. Follow our Twitter account @pre_desire, or our Newsticker @dynamicons for the latest information. However, 100 days after each release, an update info will remind you that we are delivering new versions of Predicted Desire and all its successors is on a monthly basis.
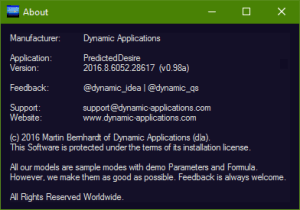
- Info…
will show a dialog with basic contact and version information.
Time Ruler
![]()
The top central Time Ruler Panel consists of various icons with additional functionality, and the central time controller itself. We’ll first explain the Central Time Ruler, here.
The Time Ruler controls and determines the current point in time we’re looking at. In the example shown, there is a Time frame from 01.2016 to 01.2020. That is a period of 49 months (48 + 1). So the Time (t) that has passed since starting the simulation will run from 0 to 48, which makes up for 49 values, again. You’ll see a small “t: 0 months” display next to the date display. If you move the Time Ruler forward, it’ll show you the total Time that has passed since the beginning of the simulation.

Every Input and Target Value that there is in Predicted Desire will get a discrete value for every month. When the program is starting up, all values will be stable over time, so all 49 values will be the same as the starting value. Now this is not what we see in nature. Typically, about any value in the world will change over time. Therefore, you can define via the Input Value Panel how you estimate this starting value is going to elaborate: it could go up, it could go down, it could accelerate over time, it could be a trending value, it could reach a mountain’s top, then fall down again, and it could saturate. Whatever we choose here will now change all the 48 values that follow the starting value.
If you now move the Time Ruler around, Predicted Desire will know that you want to look at another moment in time. It will inspect all its Input Values, and for every Target Value that there is, it will use its Formula to calculate the target result right at that moment, respecting all depending Input Values and sub-Formula that there is. This will be so fast that all you see is the correct Target Value result at that moment. So, Predicted Desire will calculate a result that will certainly occur exactly if only you were right about estimating your Input Values.
Since most Formula in a System Dynamics Simulation Model are typically additions or multiplications, if you fail to guess an Input Value’s development exactly, any dependend Target Value would get a slight uncertainty. However, in almost all cases, it’s best to take a good guess at a value’s development. Leaving it stable over time will not help you at all, as this could as well be totally wrong. So that’s what we criticize and address here – every normal, standard computer program would fail here, we do it right.
Finally, after calculating all Target Values, the Result Graph Display will be updated as well. A fine, vertical line will appear and show you the moment in Time we are at.
In the Detail Input Panel, that line will also determine the point in time where our variation starts, that means, the point in time where the function (up, down, …) you’ve just applied will start to modify your value. So, to define an Input Value’s development as a whole, you have to move the Time Ruler to the very left. However, it is also possible to move it to a certain moment, and start the variation from there. This way, we can easily simulate effects where we have a delay before some effect will occur.
Note that even using the Time Ruler, you can never enter a Target Value, directly. If you did, the connection to its Input Values would be destroyed, the underlying Formula would be nonsense, and the whole equation system would easily get out of balance. So, if you want to change a Target Value over time, use its ToolTip to determine the underlying Input Values, and determine the right one that you really want to modify.
Squared Icons (Top Left)
(1) Dynamic Applications Icon
![]()
will lead you to our Homepage, dynamic-applications.org. Note that the Support Menu includes a direct link to the Top Favourite Idea and Top Favourite Roadmap Charts. We are counting any favourite and retweet for each single tweet, and publish our prioritized ranking charts.
(2) Balanced Scorecard Icon
![]()
a click on this icon will open a window showing a Balanced Scorecard that visualizes the calculation model of our Startup Calculator simulation model. Note that for specific simulation models, like the Photovoltaic System Simulation, a specific Scorecard may be included. See the Introduction to Balanced Scorecards section for more.
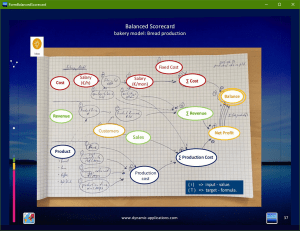
The Balanced Scorecard Icons are only available when the Header Banner is visible, which you can select in Options Menu, but the functionality can as well be reached from the Documentation Menu under Balanced Scorecards.
(3) Simulation Model Selector

a click on this icon will show the Simulation Model Selector and give you the ability to load a new Simulation Model that will show a different Business Model Planner, then.
Squared Icons (Top Right)
(1) Scorecard: Management
![]()
will open the Balanced Scorecard: Management picture. Here, we’ve translated a flow chart of System Dynamics Archetypes that describe typical situations of a typical Company’s management. Start at the top and follow your way through the chart to identify your current situation. A click on the picture will lead you to a Wikipedia page describing all the small interior Balanced Scorecards in detail.
The Balanced Scorecard Icons are only available when the Header Banner is visible, which you can select in Options Menu, but the functionality can as well be reached from the Documentation Menu under Balanced Scorecards.
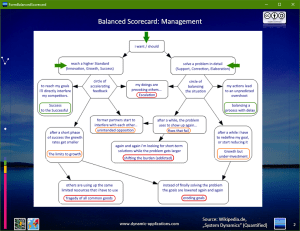
We thought that in managing a company, even if as small as a startup, it’s always of critical importance to understand your situation. In every situation, there is a way to follow. We intend to train you, here. Also, you can see that about every situation has its advantages and burdens. Just remember that everyone is underway in this picture. No reason to get frustrated. The optimal next target depends on your position as well as what you want to achieve.
From v2.04, a secondary click on the same panel will add another Balanced Scorecard that shows a typical situation when you are pursuing a Growth Hacking strategy, i.e. you mainly focus the growth of your Startup or Small Business by calculating excellent price points, and incorporating your marketing into the product, itself. So your product is the marketing by features, price, and users can interact with or vote for the product, or discuss things in a SocialMedia network or channel that you have invented or connected to the platform itself.
In that case, if the product is really good, people who like the product will start recommending it all by themselves, as it offers an exceptional value for price, which is what you guarantee.
What then happens is typically that you move into growing towards the Limits to Growth, also the Success to the Successful circles on the left, so that’s perfect. Since you can not focus on every circle in the diagram at the same time (especially, if you’re small), you’ll either have to leave problems unsolved or workaround, or you’ll see Growth but Under-Investment.
In the second diagram, we’ve used a new colouring scheme from
- white => green => yellow => orange => red.
So white means “never thought about that”, green means “promising – arriving”, yellow means “sunshine”, orange means “it’s getting a little warm in here”, and red means “you are about to burn your fingers here”.
So how do we address that? – in most projects that fail, what we see isn’t really a lack of technology, but a lack in trustful relationship with the customer. These may be caused by a one-to-one problem, but it could also be caused by an incompability in company culture.
So your partners and customers have other key values than you have, or they’ve just sorted them another way. In that case, we recommend to develop an outstanding company culture, yourself, in the first place. A company’s culture decides much about any trustful relationships with your customers. Now if someone criticizes you and you give in immediately, this will resolve the current issue, but may raise questions of trust with other customers. So we recommend to be transparent in your culture and your values and communicate these openly to every customer, even if they decide not to buy (as more trouble would come up later).
In case you see the Growth but Unter-Investment circle warming up, beware, as that’s going to be a real problem if it intensifies. So for example, if you try to hit the market with full force by doing exceptional prices, but you haven’t calculated them well, and you have extra cost, your business may go all down the road. Think about how to fix your solution or concept so that you get back on a way towards a “black zero” in your company’s balance.
If you do it in due time, in most cases, a slight change to your company’s habits and business model combinations may lead you to the path of prosperity again. If you fail, it’ll get worse.
(2) Dynamic Idea Icon
![]()
will lead you directly to our Twitter account, @dynamic_idea. This is our implementation of a dynamic idea collector. Every time someone sends us an interesting idea, we’ll be glad to post a tweet about it. A user voting is included. Every month, we’ll fix the top voted bug first. In the remaining time, we’ll work on implementing your Top Voted Ideas. Here, you can vote for your favourites and send in any new ideas you want to see in the future.
So we follow the idea that all the time, you can vote for the next big thing we’re going to publish. If your model is already available, we’ll attach a tweet informing about it. You can still vote for that model though if you wish it to be even more refined and detailed.
(3) Dynamic Roadmap Icon
![]()
will lead you directly to our Twitter account, @dynamic_qs. Here, we collect our feedback, your feedback. A user voting is also included. Feel free to send in any bug, feature or enhancement request against the Predicted Desire simulation platform. To make things easier for you, we don’t make a difference between bugs and enhancements. It is our clear intention to always work on your top voted issues, first.
However, if your bug request didn’t make it to the top of our Top Voted Bugs, you’ve got to either motivate everyone you know to push that issue upward, or accept that other things are more important to others.
If you’re really in a hurry, we’ll be glad to prioritize customizations on a paid-for basis. So a fair competition is all you can get for free, here.
Settings and Options.
![]()
![]()
- Dark User Interface Theme
allows to switch between the dark UI theme (default) with bright text upon, and the new light UI theme with light-gray background and dark text upon.
This option is available direcly from Options menu.
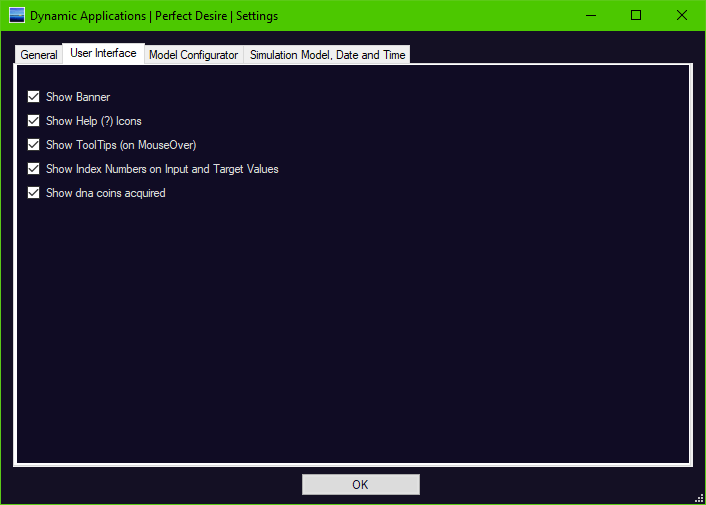
- Show Banner
shows a moody picture banner at the top of the simulation. If you have got a rather small display, and want to use it to full extent, you can disable the banner here, and get a more compact Time Ruler representation.
- Show Help (?) Icons
shows a (?) icon at the Top Left Position of every User Interface Panel. If you click on the (?), it’ll lead you directly to the right section within this documentation.
- Show ToolTips on MouseMove
explanatory Tooltips show up on all icons of the main panel, as well as the coloured panels of Input Values and Target Values. If you don’t need them anymore, switch them off here.
- Show Index Numbers on Input and Target Values
If activated, every Input, Target and Stock Value will show an automatic index number. This is basically for identification of items if there are very many, and the colours get close to each other. As new users may find these additional numbers a little irritating (optical noise), it’s an option for the experienced user, only. So you have to activate this in Options/Settings.
The simple checkboxes in Options/Settings are activated, immediately on pressing the check. So you can see how they work, live.
In case of a mistake, simply re-open the dialog, and correct your UI options as you prefer.
- Show dna coins acquired
![]()
Activates a small display showing your currently acquired dna coins in the Main Menu.
It sounds like BitCoins, but don’t you worry.
First of all, dna coins are wasting no computing power at all.
dna coins are implemented as just being a simple counter inside each Dynamic Application.
- You’ll get 1 dna coin for starting up the software.
- You’ll get 1 dna coin for starting up a simulation model inside the software.
- You’ll get 2 dna coins for calling the Website through any Menu item or Help icon.
And so, dna coins are your personal award for using Dynamic Applications.
Once in a while (on 2nd, 4th, 7th, 11th, 16th, 22th dna coin reached), you’ll get additional rewards. And once you’ll reach 1000 dna coins, you’ll be upgraded to Perfect Desire mode, free of charge.
Any simulation model. All features.
![]()
Congratulations!
- Simulation Model Configurator
![]()
The Simulation Model Configurator allows you to choose which Simulations Models shall be shown in the Simulation Model Selector, and it allows you to order them as you prefer.
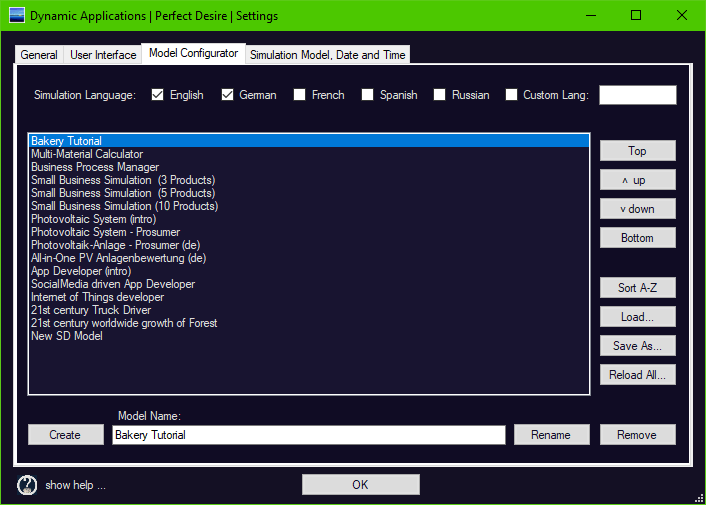
In the top row, you can select your language(s) of choice. All simulation models carry a language description, and so the software will hide those that you have deselected, here.
On the top right, you can enter a custom language description that will then be used to save your models, as well.
In the center, you’ll see the Simulation Model list as currently ordered.
On the right, you’re able to move the selected Simulation Model to the Top, up, down, or to the bottom.
You’ll be able to Sort all Simulation Models from A..Z, alphabetically.
You’ll also be able to load and save Simulation Models to disk.
Using the Reload All button, you can reload all simulation models from disk. As this will destroy all your currently loaded models, a dialog box will ask you to confirm.
On the bottom, there’s your possiblity to Create new simulation models. Here, the software will allow you to create derivates, Rename existing models, or Remove them from the list of Simulation Models shown within the Simulation Model Selector.
Note that using this dialog, Simulation Models will never be deleted from disk. As you may store your simulation models in whatever location you prefer, you’ll have to order and delete them on disk, manually.
Also please note that to extend the list of available languages, feel free to check their options.
However, since the list of built-in Simulation Models is created at System Startup, it will be required to restart Dynamic Applications to have all Simulations Models in all configured (checked) Languages available in the SD Model Selector dialog.
- Simulation Model, Date and Time Settings
![]()
Most Simulation Models, per default, start at the beginning of the current year, e.g. 01 Jan 2016.
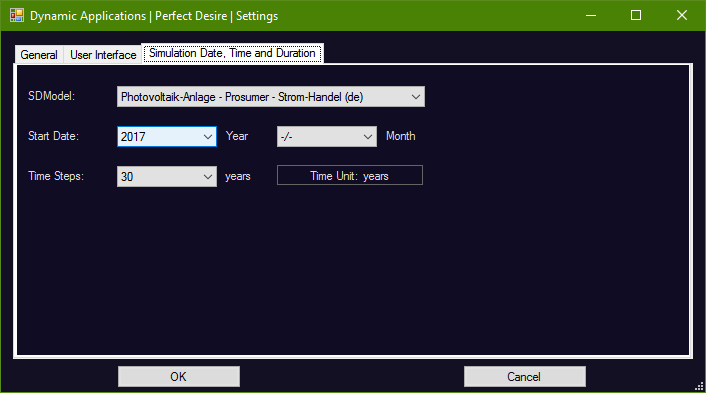
This dialog allows you to enter or estimate a few values from the past, and continue setting up your predicted developments from there.
For Simulation Models that are configured in years, you can select here a Start Year of simulation, from 1984 to 2020. For Simulation Models that are configured in months, you can select here a Start Month of simulation from 1 to 12 (Jan … Dec), and a Start Year as above.
Further on, you may also configure the Time Steps, i.e. the quantification of Time, itself! It was a user favourite back then, in early 2016. As you know we make everything possible in due time, which is endless by definition, and therefore we decided to add configurable Time Steps, as well.
It’s a little limited at the moment in that you have to choose from 10…120 time units, but, we thought ergonomy has a demand for readability and reasonability, as with everything.
Time settings can be saved as well, this is automatic. We support to save one configuration.
Changes in this section will require a restart of the Simulation Model, as the central Time Ruler will be affected, but it automatically opens the Simulation Model Chooser for you.
It is neither possible to select the starting month for a simulation model configured in years, nor can you change the basic Time Unit, yet. This is because all calculations are pre-configured for the Time Unit given, and if you change that one around, a lot of funny Target Values could be resulting from this. And we are much about reliable business models.
Should you prefer to have more options to choose from, please vote here.
In theory, we’ll support any Time Unit from seconds to minutes, hours, days, weeks, months, up to a 120 years maximum.
But as always, we prefer to work on the topic that got the most votes, in RT and Fav.
Navigation:
Page 1 -> Top: Main User Interface – Model Selector – Time Ruler – User Voting
Page 2 -> Next: Input Values – Target Values – Formula – Result Graphics – Detail Values
Dynamic Applications.
![]()
Dynamic Applications is a small business consultancy focused on customers, product cost, efficiency, sales, and net profit. We support Startups in developing 21st century Business Models. We’re driven by thousands of independent voters. Altogether, we create Small Business Developments, an evolving platform of free and simple business plan calculators for everyone.
We vote in online democracy, we deliver for free. we work for you, and we call them Dynamic Applications.
SocialMedia driven innovations for the 21st century. And you could be one.
at Dynamic Applications, we work to empower people.
we are Sharing Economy. Follow us to gain.
Thank you for choosing to visit Dynamic Applications, today. Comment section is open.
